Gleap allows you to log network requests, which will be available for inspection with every bug report. This helps your team to fix bugs a lot faster.
Depending on the platform you are running on, you will need to do some additional setup to get started with network request logging.
Gleap allows you to strip off specific key/value pairs from network logs. This empowers you to easily remove sensitive data like tokens, passwords or usernames.
How does it work?
Log in to the Gleap dashboard and open the visual widget configurator. Now enable the network log filters option (within the advanced options tab). Once the option is enabled, you can add multiple keys to the array bellow, which should be excluded.
All keys, which you add to the exclusion list, will be loaded together with the widget configuration. Before sending a feedback item to our backend, the client SDK will loop through all network requests and stripe off all matching key/value pairs from the request headers, header-payload (if it's a JSON) and response body (if it's a JSON).
This ensures that sensitive information will never even leave the client application.
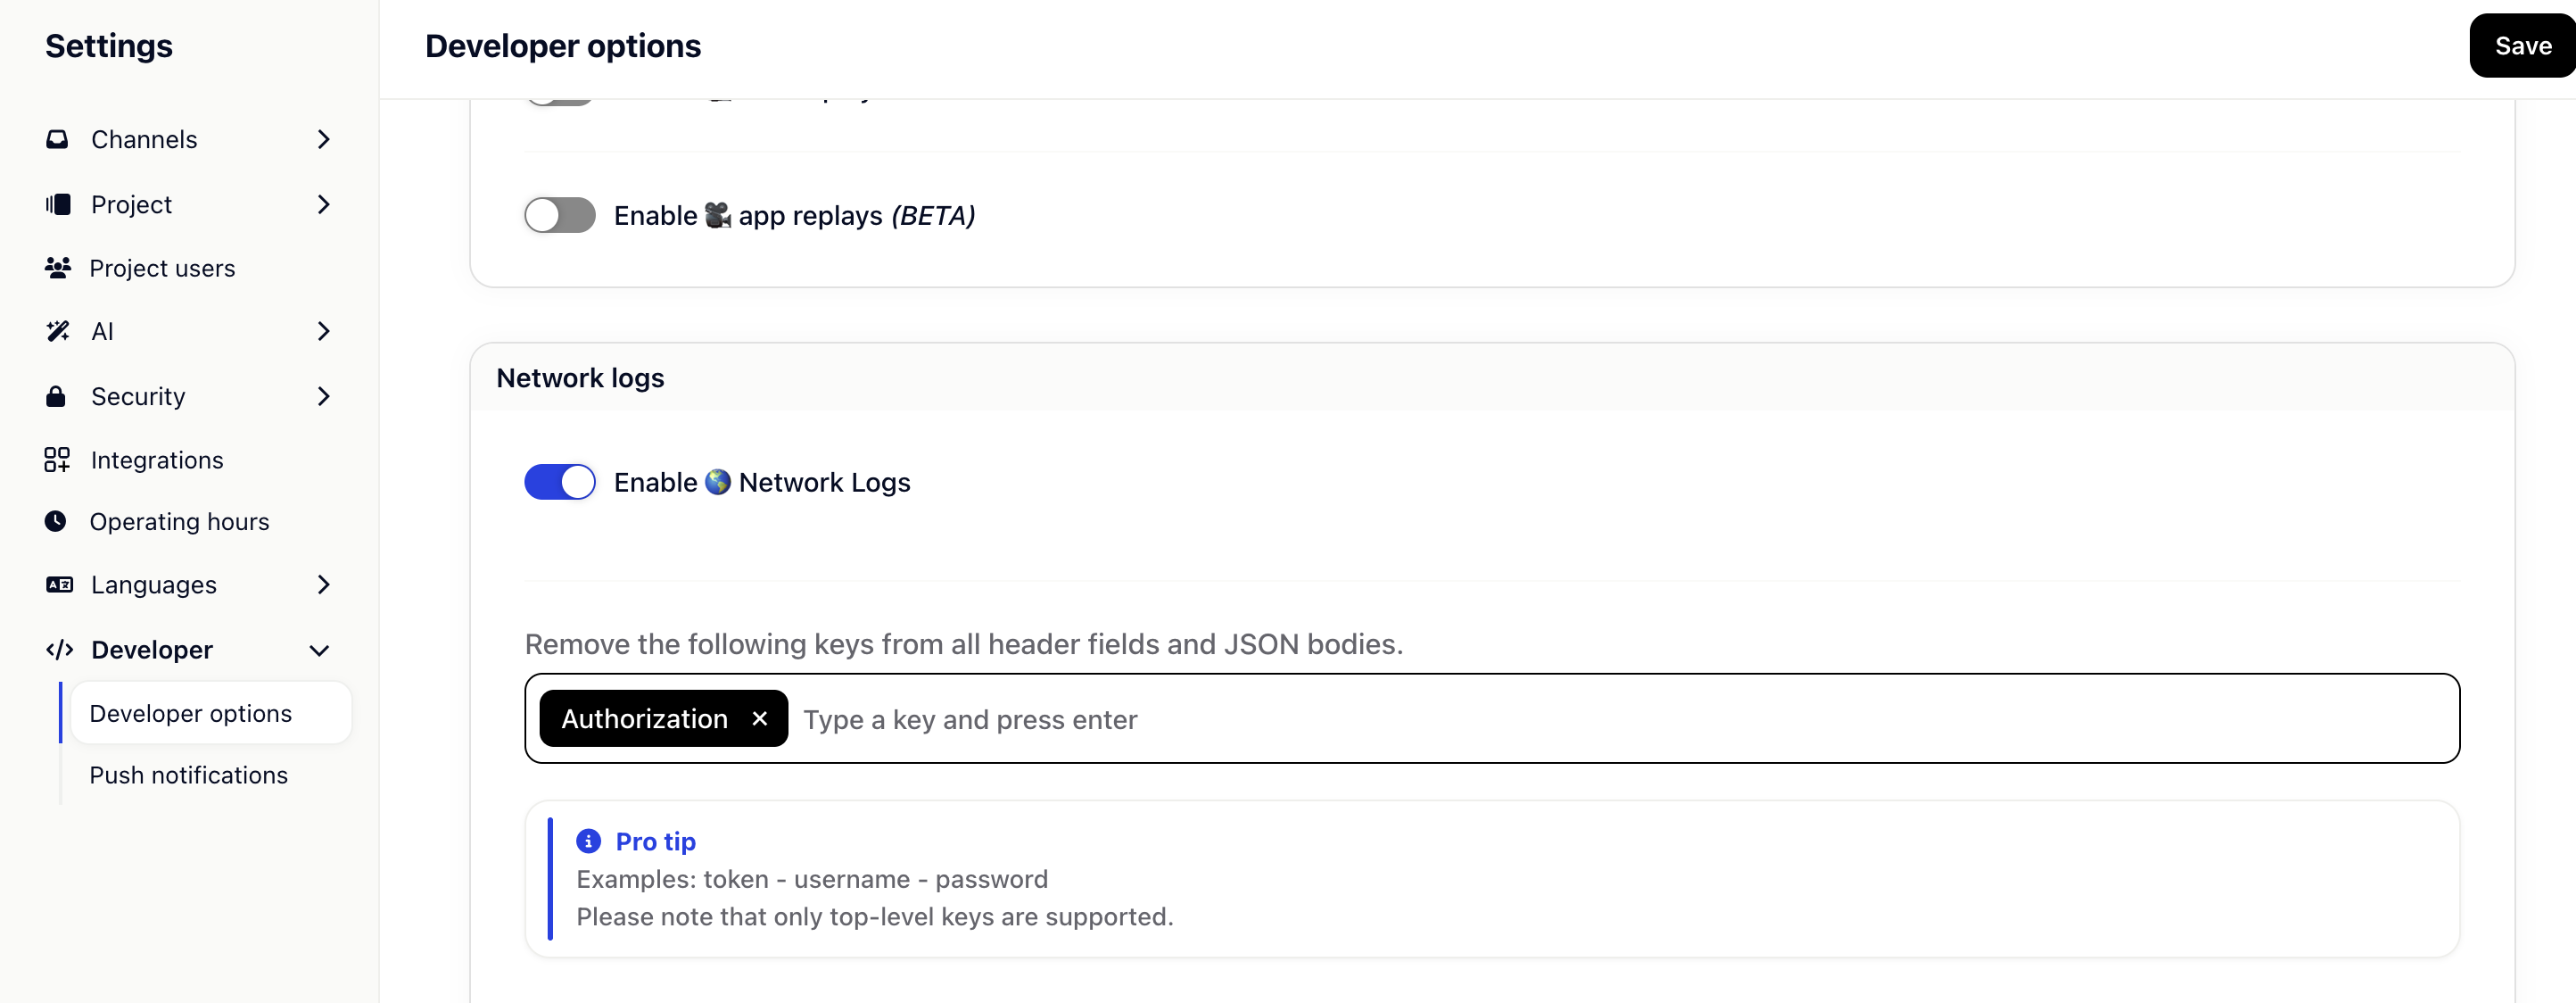
Example:
If you want to remove the Authorization bearer token from your requests, simply add "Authorization" to the list of keys.
It is possible to blacklist URLs or parts of URLs. If a network request matches one of the entries in the blacklist, the network request won't be included in the network logs.
To add a new entry to the blacklist, simply navigate to your project in the Gleap dashboard and open the visual widget configurator. Now click on Developer options and add the desired URLs.